
 People · Events · Communities

Quick answer: AI association reporting combines automation and AI: data flows from one member record into scheduled dashboards, and AI drafts the narrative, explains changes and flags variances. To set it up, define your KPIs once, put your data on one record, build recurring dashboards, schedule reports, let AI draft the summary, and have a person check every number.
Key takeaways
-
Automate the data flow first; AI only drafts the story on top of it.
-
Agreed KPI definitions and one member record come before any AI.
-
Use aggregated numbers in AI tools, never member-level personal data.
-
A person checks every figure and owns the final report.
The quarterly board report at most associations follows the same ritual: export members from one system, attendance from another, dues from accounting, open rates from the email tool. Merge them in a spreadsheet, check why the numbers do not match, then write the summary late at night.
Automated reporting replaces that ritual: data flows from one system into recurring dashboards, and AI drafts the narrative, so staff spend an hour reviewing instead of three days assembling. This guide to AI association reporting explains what AI can and cannot do, six steps to automate your reports, the nine KPIs worth putting in front of your board, and the guardrails to keep it accurate. It comes with a free board report deck template, and it is part of our AI for associations hub.
What is automated association reporting?
Automated association reporting means your board, membership, event and financial reports are built from live data in one system, refreshed on a schedule, and summarized in plain language, with staff reviewing the result instead of compiling it by hand. Automation handles the data flow. AI handles the first draft of the story. For more on where automation ends and AI begins, see how AI is changing association management.
Why is association reporting still so manual?
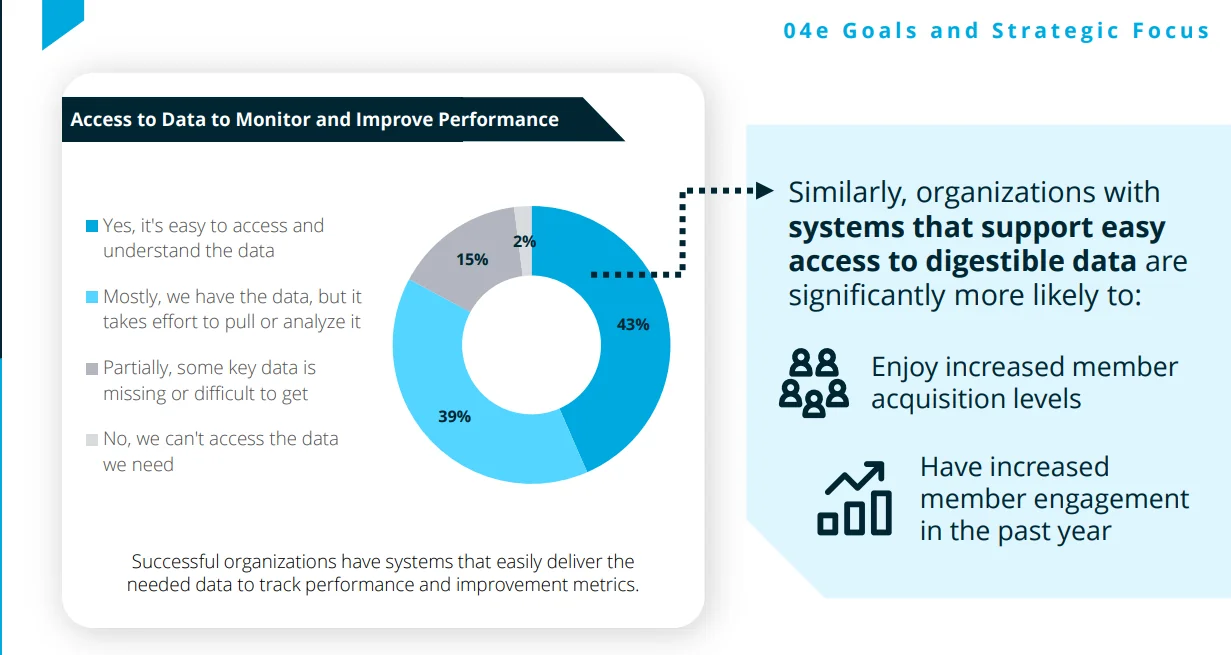
Because the data lives in too many places. In the iMIS 2026 Membership Performance Benchmark Report, less than half of membership professionals said they can easily access and understand the data they need to monitor and improve performance. When every number starts with an export, the report becomes a project no matter how good the AI is.
What can AI do for reporting, and what cannot it?
-
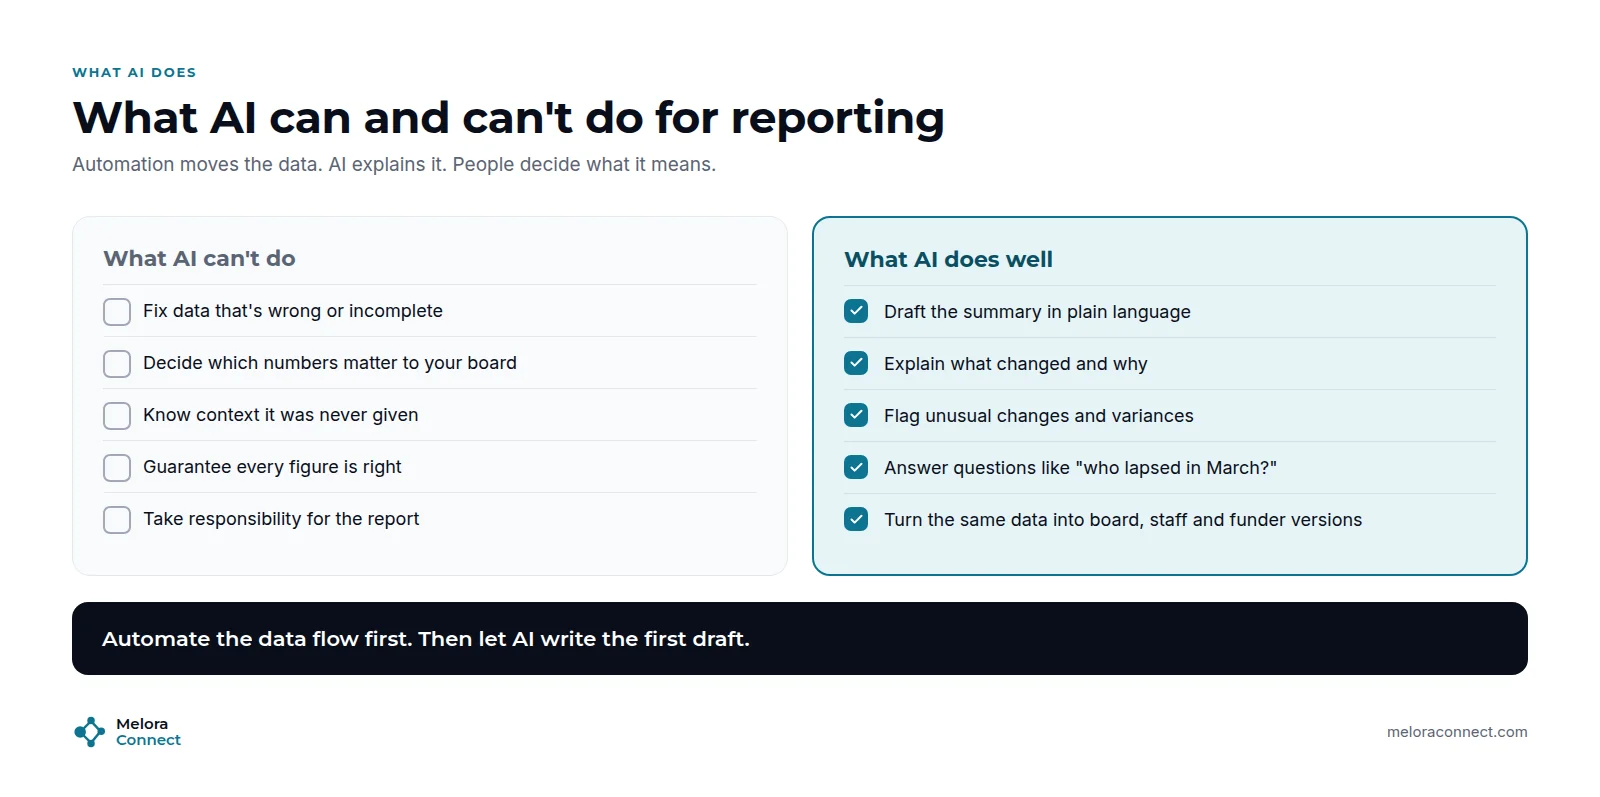
AI does well: drafting the summary in plain language, explaining what changed and why, flagging unusual changes and budget variances, answering questions like “who lapsed in March?”, and turning one data set into board, staff and funder versions.
-
AI cannot: fix data that is wrong or incomplete, decide which numbers matter to your board, know context it was never given, guarantee every figure, or take responsibility for the report.
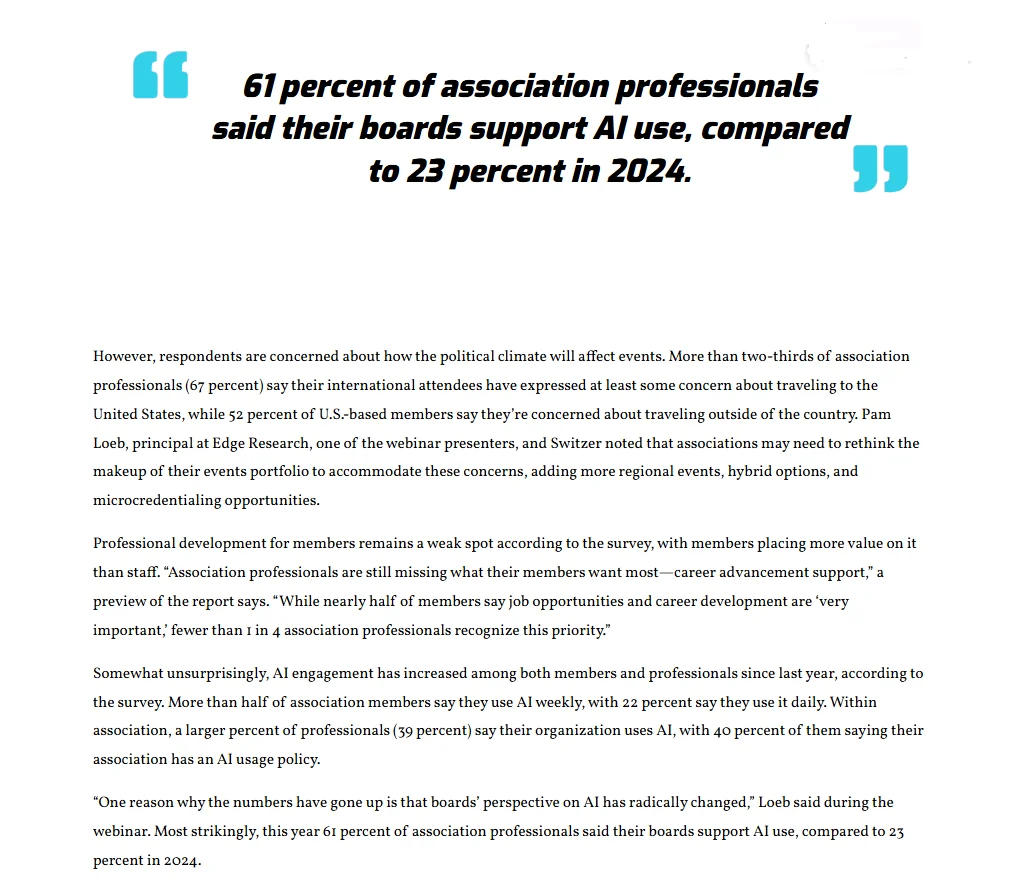
Boards are increasingly open to it. In Momentive Software’s 2025 Association Trends Study, reported by Associations Now, 61% of association professionals said their boards support AI use, up from 23% in 2024, and 36% already use AI to analyze event data. In short: automate the data flow first, then let AI write the first draft, and keep a person accountable for every number. For the other admin tasks AI can take off your team, see our guide to AI for association staff.
Which reports do associations run most?
| Report | Audience | Rhythm | Key numbers |
|---|---|---|---|
| Board report | Board of directors | Monthly or quarterly | Members, renewal rate, net growth, revenue vs budget, decisions |
| Membership report | Staff and committees | Monthly | New, lapsed, renewals due, first-year renewal, at-risk members, by chapter |
| Event report | Staff, sponsors | After each event | Registrations, attendance (in person and online), first-time attendees, CE credits issued, revenue |
| Financial report | Board, finance committee | Monthly | Dues, events, sponsorship vs budget, open invoices |
| Funder or annual report | Funders, members | Yearly | Reach, engagement, outcomes, stories |
How do you automate association reporting in 6 steps?
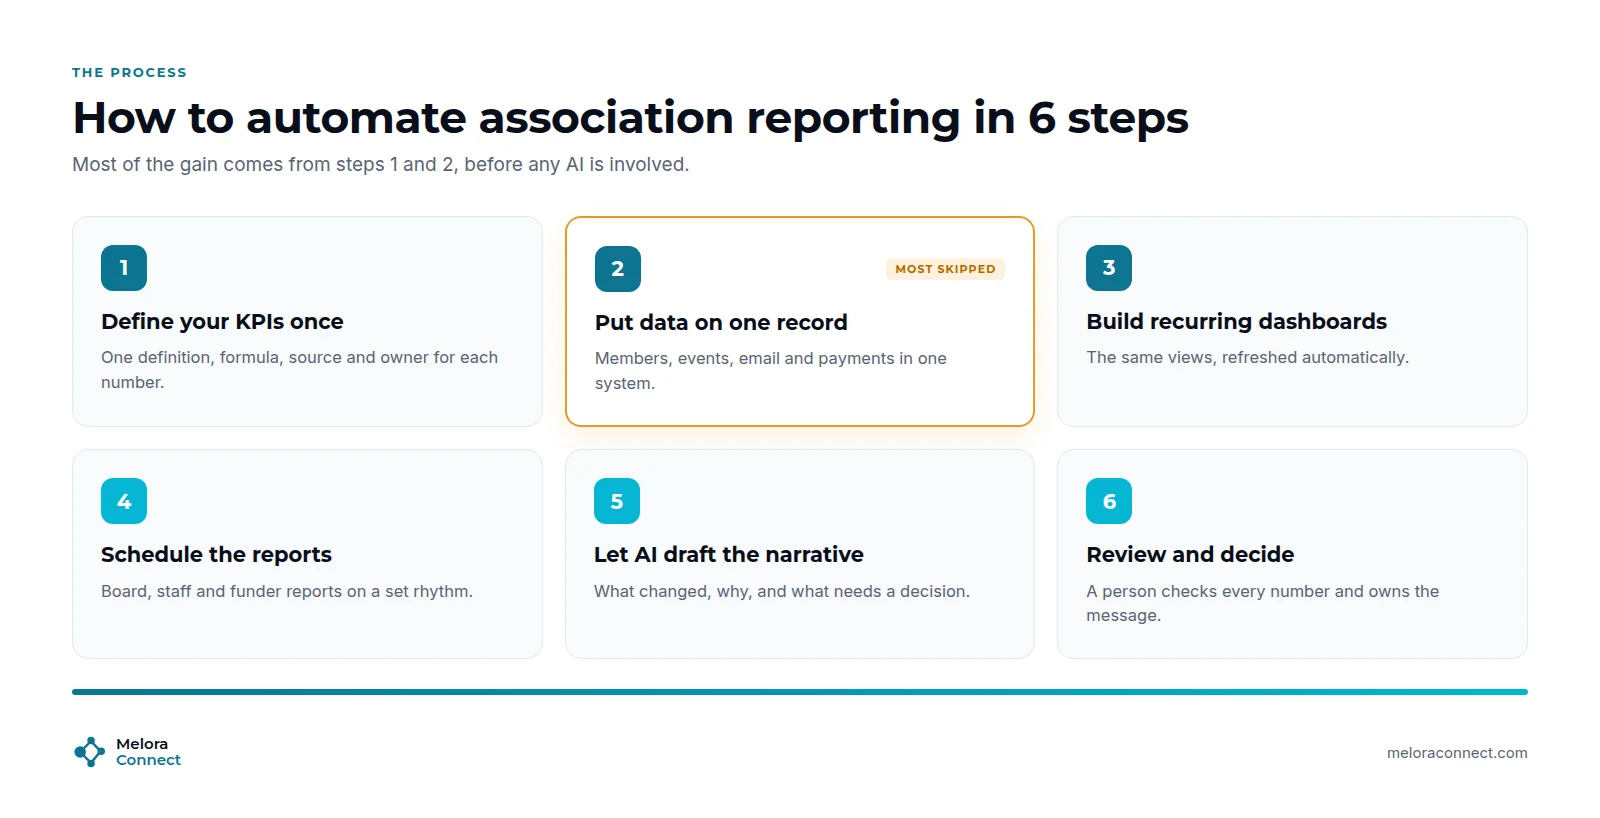
To automate association reporting, define your KPIs once, put your data on one record, build recurring dashboards, schedule the reports, let AI draft the narrative, and review and decide.
1. Define your KPIs once
Write one definition, formula, source and owner for every number you report. Renewal rate, for example, is members who renewed divided by members eligible to renew, times 100. When everyone uses the same definition, the numbers stop being debated and start being discussed.
2. Put your data on one record
This is the step most teams skip, and the one that makes the rest possible. If members, events, email and payments live in five tools, every report starts with exports. When they live on one member record, reports can refresh themselves.
3. Build recurring dashboards
Create the same views for every period: membership, engagement, retention and revenue, broken down by chapter if you have them. Fixed views make trends visible and save rebuilding the same charts every quarter.
4. Schedule the reports
Set a rhythm: a weekly staff snapshot, a monthly membership report, a quarterly board pack. Scheduled reports arrive on time without anyone remembering to run them.
5. Let AI draft the narrative
Give AI the aggregated numbers (never member-level personal data in a public tool) and ask it to draft what changed, why it might have changed, and what needs a decision. It is a first draft, not a final answer. Our free AI Prompt Library for Associations includes prompts for summarizing feedback that you can adapt for the board narrative.
6. Review and decide
A person checks every number against the source, edits the narrative, and owns the message. The board then spends its time on decisions instead of reconciling slides.
9 KPIs for an association board report
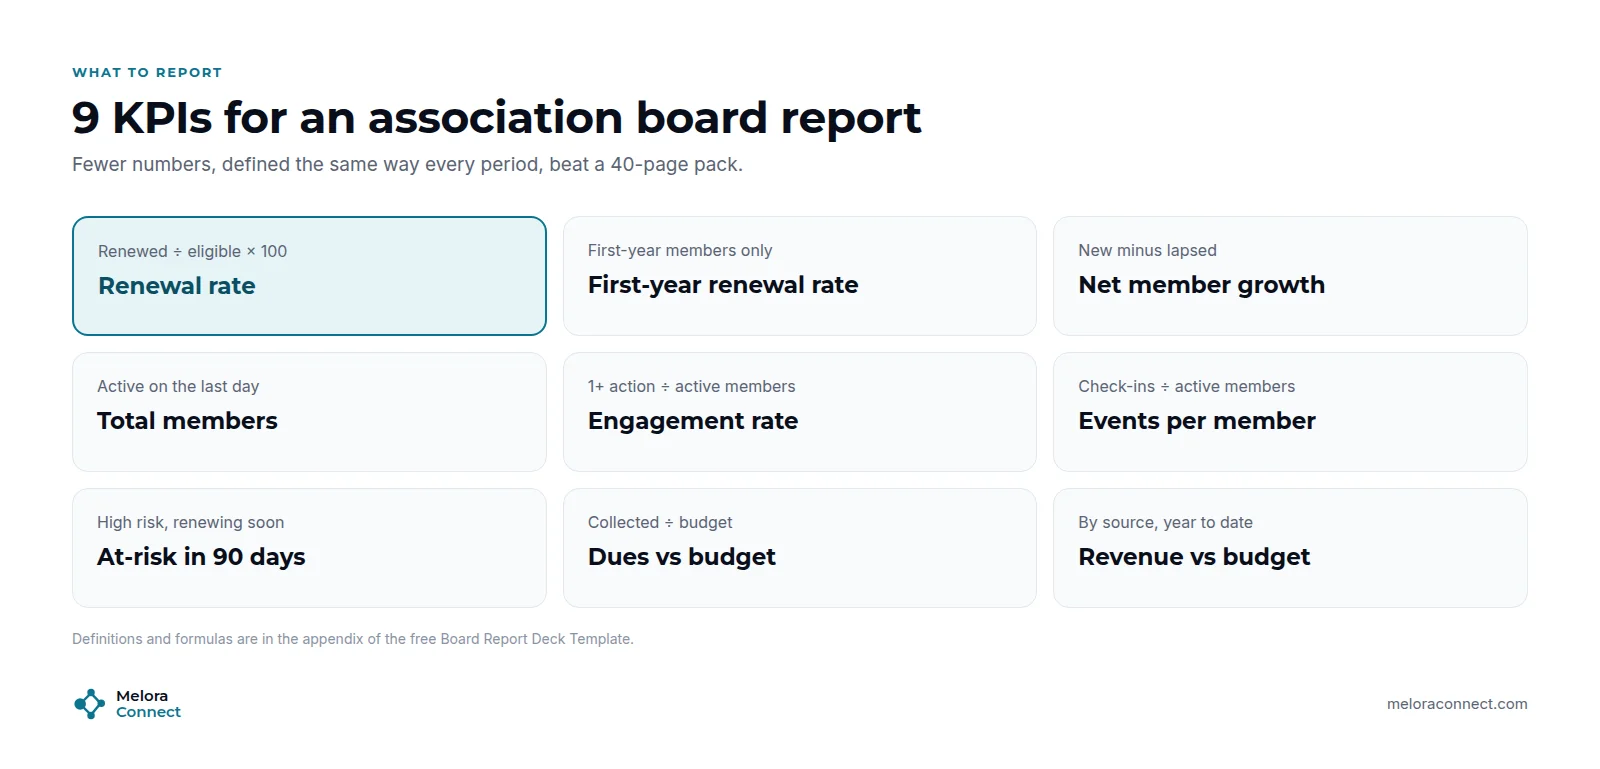
The nine KPIs for an association board report are total members, renewal rate, first-year renewal rate, net member growth, engagement rate, events per member, at-risk members renewing in 90 days, dues vs budget, and revenue vs budget.
| KPI | What it tells the board |
|---|---|
| Total members | Whether the association is growing or shrinking |
| Renewal rate | How many members see enough value to stay |
| First-year renewal rate | Whether onboarding works |
| Net member growth | Whether recruitment keeps up with lapses |
| Engagement rate | How many members take part in anything at all |
| Events per member | Whether programs draw members in |
| At-risk members renewing in 90 days | How much renewal revenue needs attention now |
| Dues vs budget | Whether the main revenue line is on track |
| Revenue vs budget | Whether each income source is on track |
First-year renewal deserves its own line, because it shows whether onboarding works. See why in What Is Membership Management? For the at-risk number, use a risk score like the ones in our guide to predictive analytics for member retention, or start with the free Member Risk Scoring Sheet. For the formula behind each KPI, see our guide to member engagement metrics. For ways AI can lift the engagement numbers before the next report, see AI for member engagement.
The free Board Report Deck Template puts these KPIs into an eight-slide PowerPoint: at a glance, membership, engagement, retention, revenue, decisions for the board, and a KPI dictionary in the appendix. Charts are native and editable, and each slide has speaker notes on how to fill and automate it.
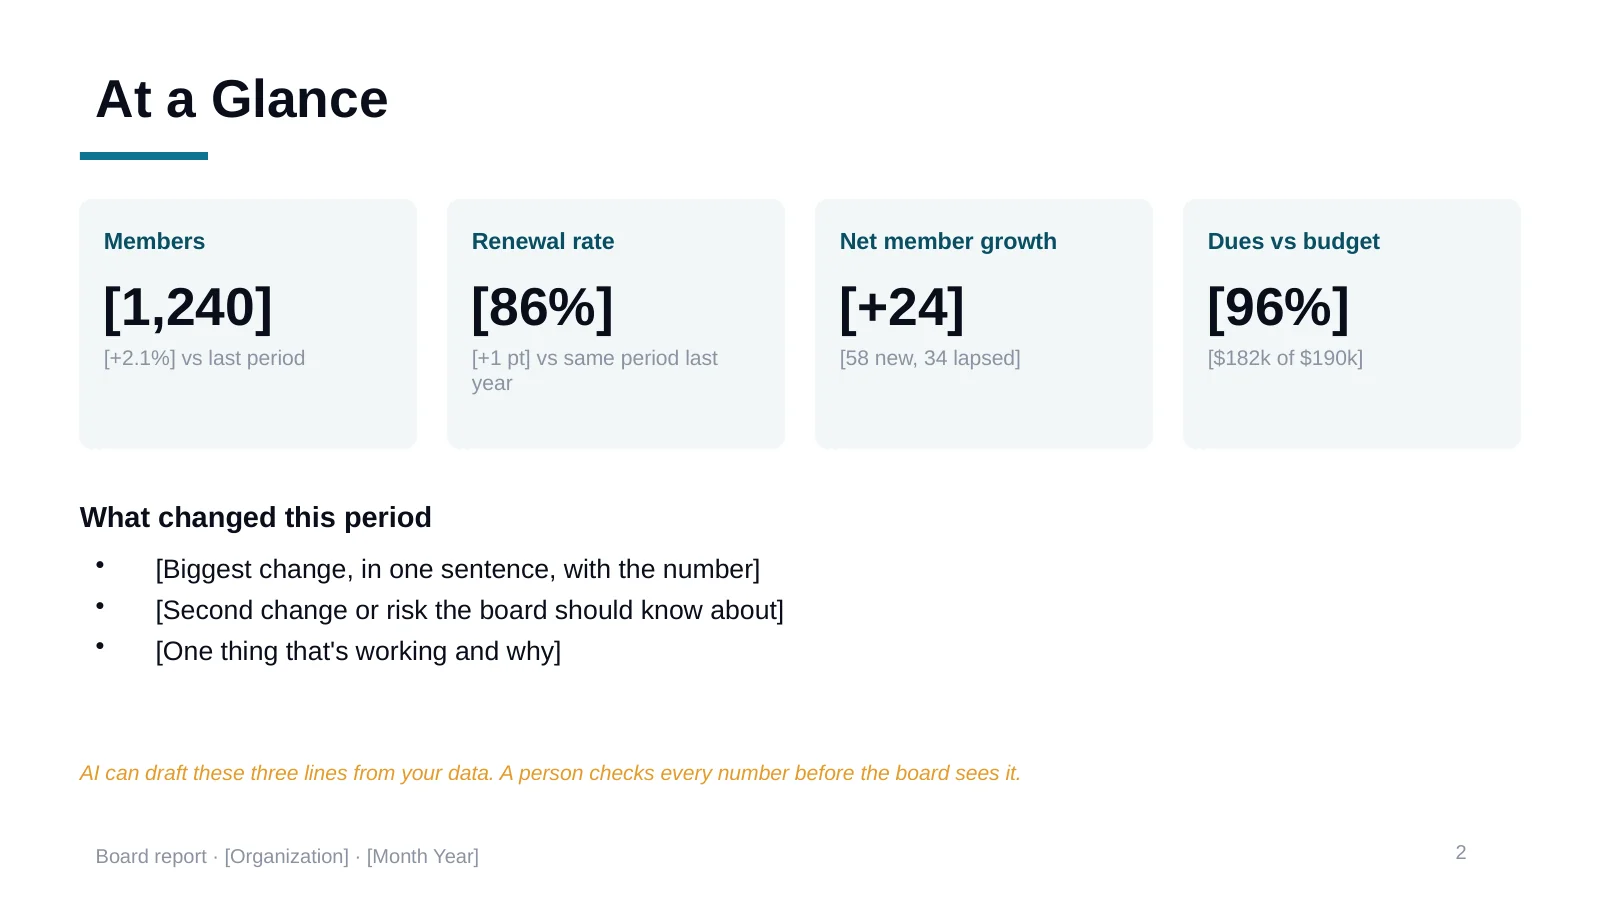
Get the board report template. Eight editable slides with native charts, speaker notes and a KPI dictionary, in English, French and Spanish. Download the board report template
Example: one board report, two ways to build it
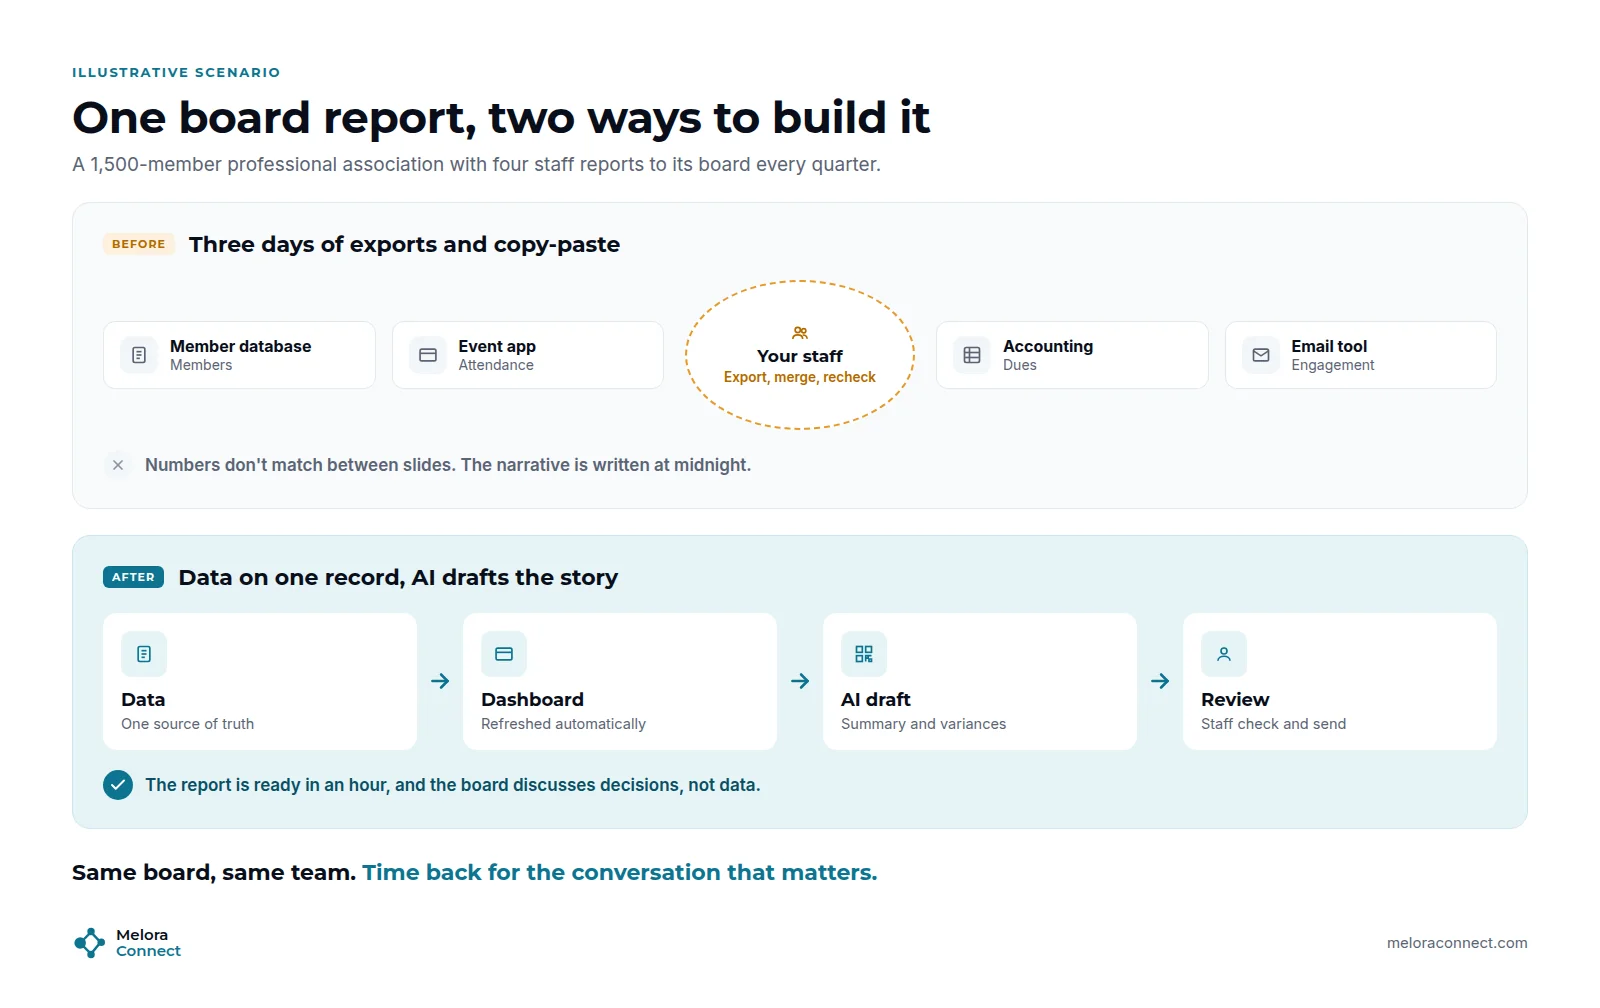
Picture a 1,500-member professional association with four staff reporting to its board every quarter.
Built by hand, the report takes three days: exports from the member database, the event app, accounting and the email tool, merged in a spreadsheet. Numbers do not match between slides, and the summary is written at midnight.
Built on one record, the dashboards refresh themselves. AI drafts the summary and flags that sponsorship is 16% below budget. A staff member checks the figures, adds context, and sends the report in about an hour. The board meeting is spent on decisions, not on reconciling data. The numbers in this example are illustrative.
See your board numbers in one place. Bring your current board report, and we will map it to live data on one member record. Book a demo
Guardrails: keeping automated reports accurate
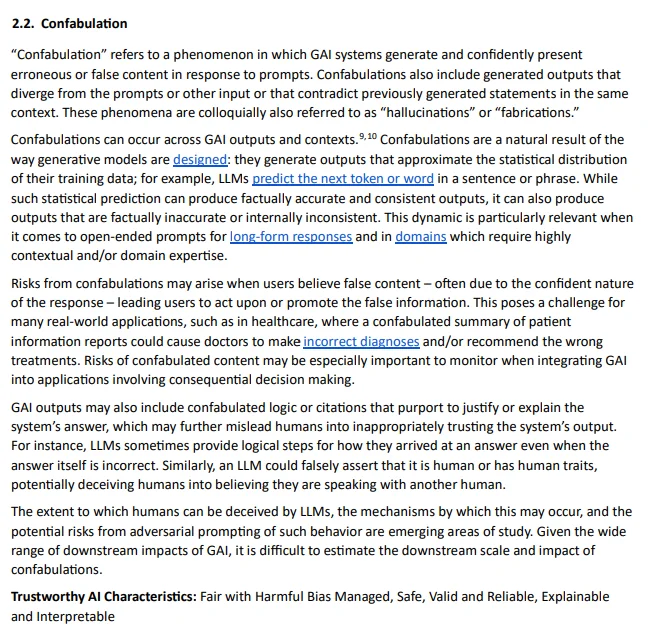
Generative AI has a known failure mode. NIST’s Generative AI Profile (AI 600-1) names confabulation, the production of confidently stated but false content, as one of the risks unique to or made worse by generative AI, alongside data privacy. In a board report, that means a trend that is not there or a number rounded the wrong way.
-
One source of truth. Every number comes from the same system, with the same cut-off date as your finance report.
-
Label AI-written text internally. Reviewers should know which parts were drafted by AI and check them first.
-
Check every figure. AI can describe a trend that is not there, or round a number in the wrong direction.
-
Protect member data. Use aggregated numbers with public AI tools, or a tool your organization has approved for member data.
-
Keep definitions stable. Changing a KPI definition mid-year makes trends meaningless; note any change in the appendix.
How Melora Connect supports association reporting
Reporting gets easier when the data is already in one place. In Melora Connect, every member has one complete record that dues, events, email, surveys, chapters and CE credits feed, so membership, engagement and revenue numbers come from the same source, and chapter-level and credit numbers come with them. The admin dashboard shows organization health at a glance, smart segments show new, at-risk and lapsed members, and a Monday morning briefing tells staff what changed in the past week. Dues and invoices export to QuickBooks Online or Desktop, so the finance numbers match.
All of this is automation that runs on rules, not AI. A staff AI assistant is coming soon. Until then, many teams paste the aggregated dashboard figures into an approved AI tool to draft the narrative, as in step 5.
And because you get a team, not a login, we help you set up the segments and views your board report needs, so the quarterly pack becomes a review, not a project.
Frequently asked questions about AI association reporting
How can AI automate association reporting?
Automation pulls data from one system into scheduled dashboards; AI then drafts the narrative, explains changes, flags variances and answers questions about the numbers. Staff review every figure and own the final report.
What should an association board report include?
A short summary of what changed, total members, renewal and first-year renewal rates, net growth, engagement, at-risk members, dues and revenue vs budget, and the decisions the board needs to make. Keep the same KPIs and definitions every period.
Which KPIs should an association report to its board?
Nine work for most associations: total members, renewal rate, first-year renewal rate, net member growth, engagement rate, events per member, at-risk members renewing in 90 days, dues vs budget, and revenue vs budget.
Can AI write our board report?
It can write a strong first draft from aggregated numbers. A person should check every figure against the source, add context the AI does not have, and approve the final version before it reaches the board.
How accurate are AI-written reports?
Only as accurate as the data and the review. Generative AI can state false content confidently, which NIST calls confabulation, so label AI-drafted text, check every number against the source system, and keep a person accountable for the report.
What do we need before automating reports?
Agreed KPI definitions and data on one member record. Without them, automation just produces wrong numbers faster. Once both are in place, scheduled dashboards and an AI-drafted narrative can turn days of work into an hour of review.
The bottom line
AI will not fix messy data or decide what your board should care about. But once your KPIs are defined and your data lives in one place, automation and AI can turn three days of report-building into an hour of review. Spend the time you get back on the conversations the numbers are supposed to start.
Free download: Board Report Deck Template. An eight-slide PowerPoint board report with editable charts, speaker notes and a KPI dictionary, so every period’s report is built the same way. Download the board report template
Turn your board pack into a review, not a project. See the admin dashboard, smart segments and the Monday briefing with your own KPIs. Book a demo
Sources
-
iMIS, Top Takeaways from the 2026 Membership Performance Benchmark Report, January 2026.
-
Associations Now (ASAE), Report: Member Loyalty Remains Strong (Momentive Software’s 2025 Association Trends Study), September 30, 2025.
-
NIST, Artificial Intelligence Risk Management Framework: Generative Artificial Intelligence Profile (NIST AI 600-1), July 26, 2024.