
 People · Events · Communities

Most associations find out a member is leaving the same way: the renewal invoice goes unpaid. By then, the decision was made months ago, somewhere between the last event they skipped and the newsletter they stopped reading.
Predictive analytics changes the timing. Instead of reacting to lapses, you use the signals members are already sending to see who is drifting away while there is still time to do something about it.
This guide explains what predictive analytics for member retention is, three risk scoring models, and a six-step process any association or chamber can follow, with or without a data team. It includes a warning signal risk score, a retention playbook by risk tier, and a free Member Risk Scoring Sheet. It is part of our wider guide to reducing membership churn.
Quick answer: To use predictive analytics for member retention, connect member data on one record, compare members who renewed with those who lapsed, turn the differences into a simple risk score, split members into risk tiers 90 days before renewal, give every tier an action and an owner, and check your predictions after each renewal cycle.
What is predictive analytics for member retention?
Predictive analytics for member retention is the practice of using past and current member data, such as event attendance, email activity, logins, and payment history, to estimate which members are likely to renew and which are at risk of lapsing. The goal is to act early, with the right outreach for each member, instead of sending the same renewal reminder to everyone.
It does not have to mean complex models. For most associations, it starts with a clear question: what did the members who renewed do differently from the ones who did not?
Why does predictive analytics matter for member retention?
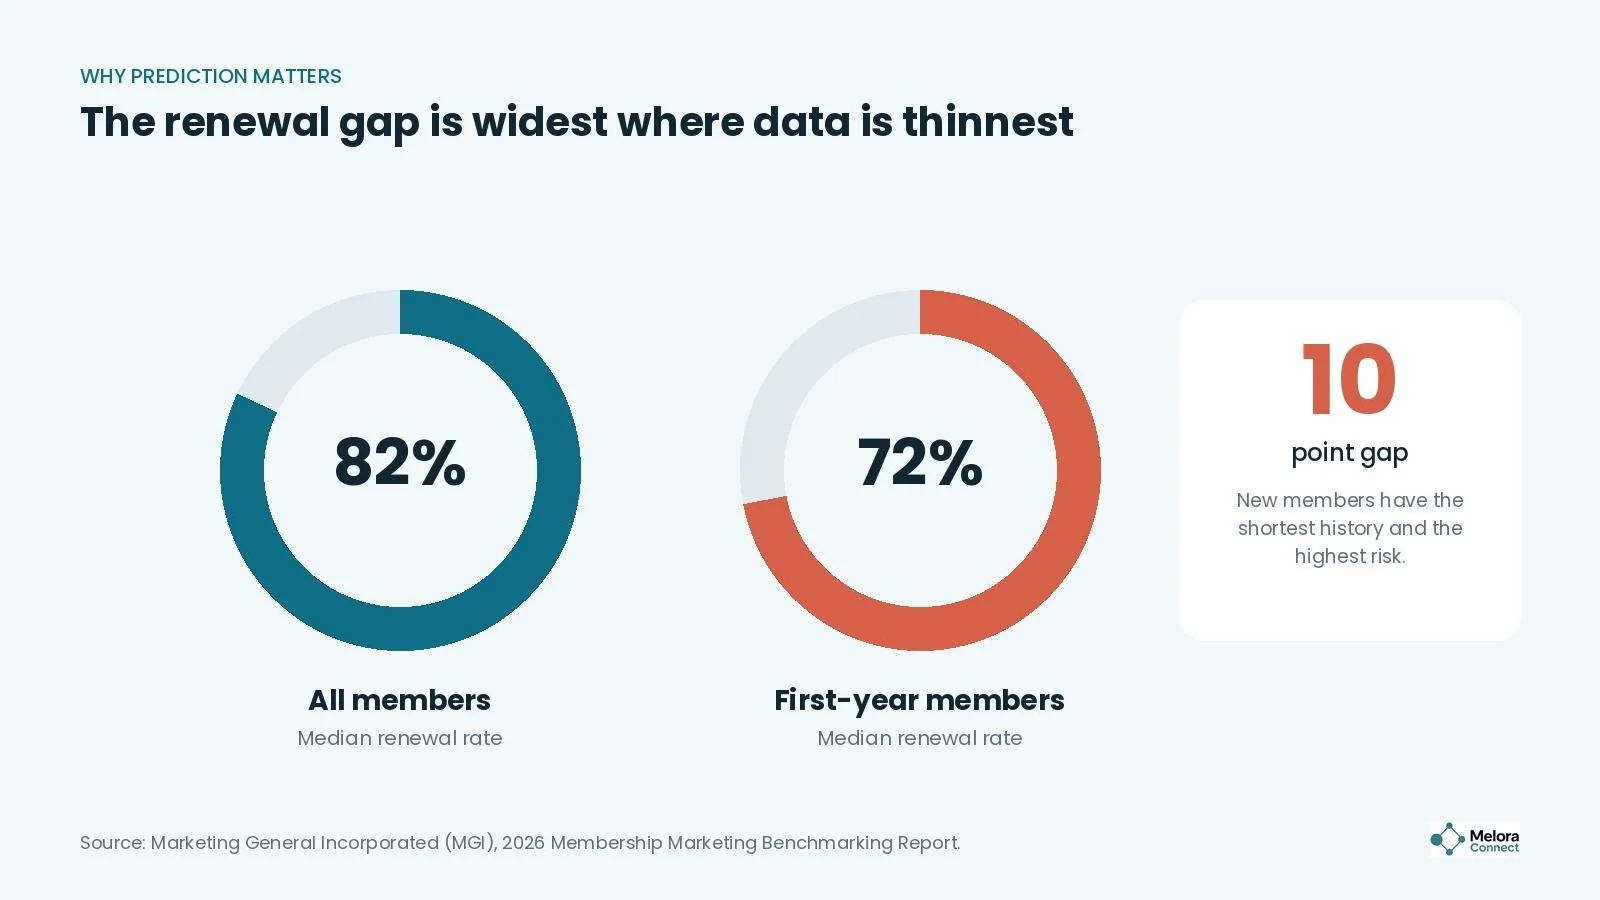
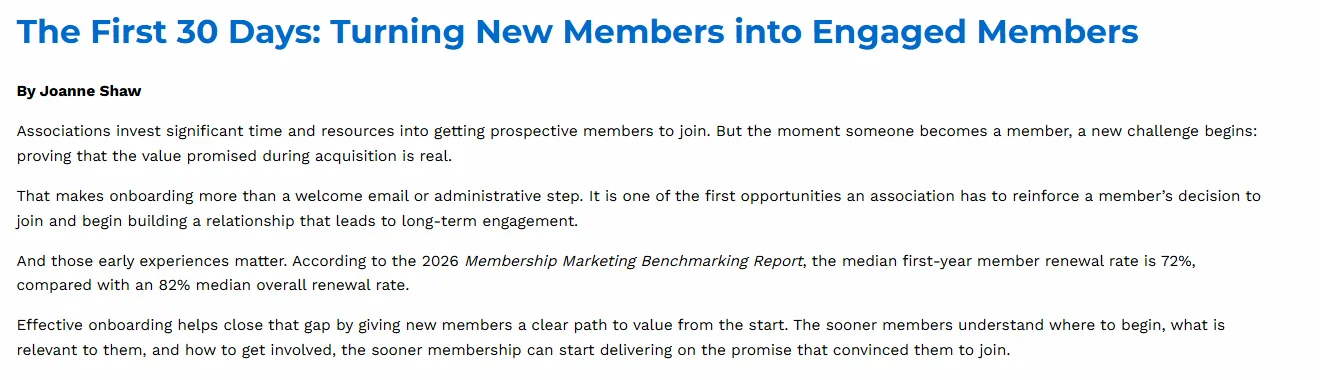
Because new members leave at a much higher rate, and you have little time to notice. As Marketing General Incorporated wrote in October 2026, its 2026 Membership Marketing Benchmarking Report puts the median first-year renewal rate at 72%, compared with 82% for all members. The typical association loses nearly one in five members a year, and more than one in four new ones.
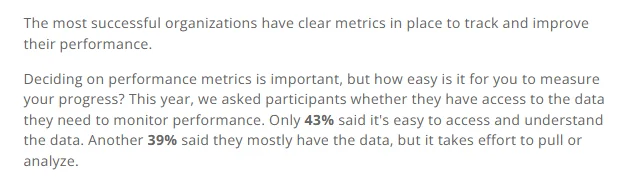
Most associations already hold the data that would warn them. The problem is getting to it. In the iMIS 2026 Membership Performance Benchmark Report, only 43% of membership professionals said their data is easy to access and understand, and another 39% said they mostly have it but it takes effort to pull. The same research found that organizations with fully defined, regularly reviewed metrics were significantly more likely to increase retention. Predictive analytics is simply reading that data before the renewal date instead of after it.
Which signals predict whether a member will renew?
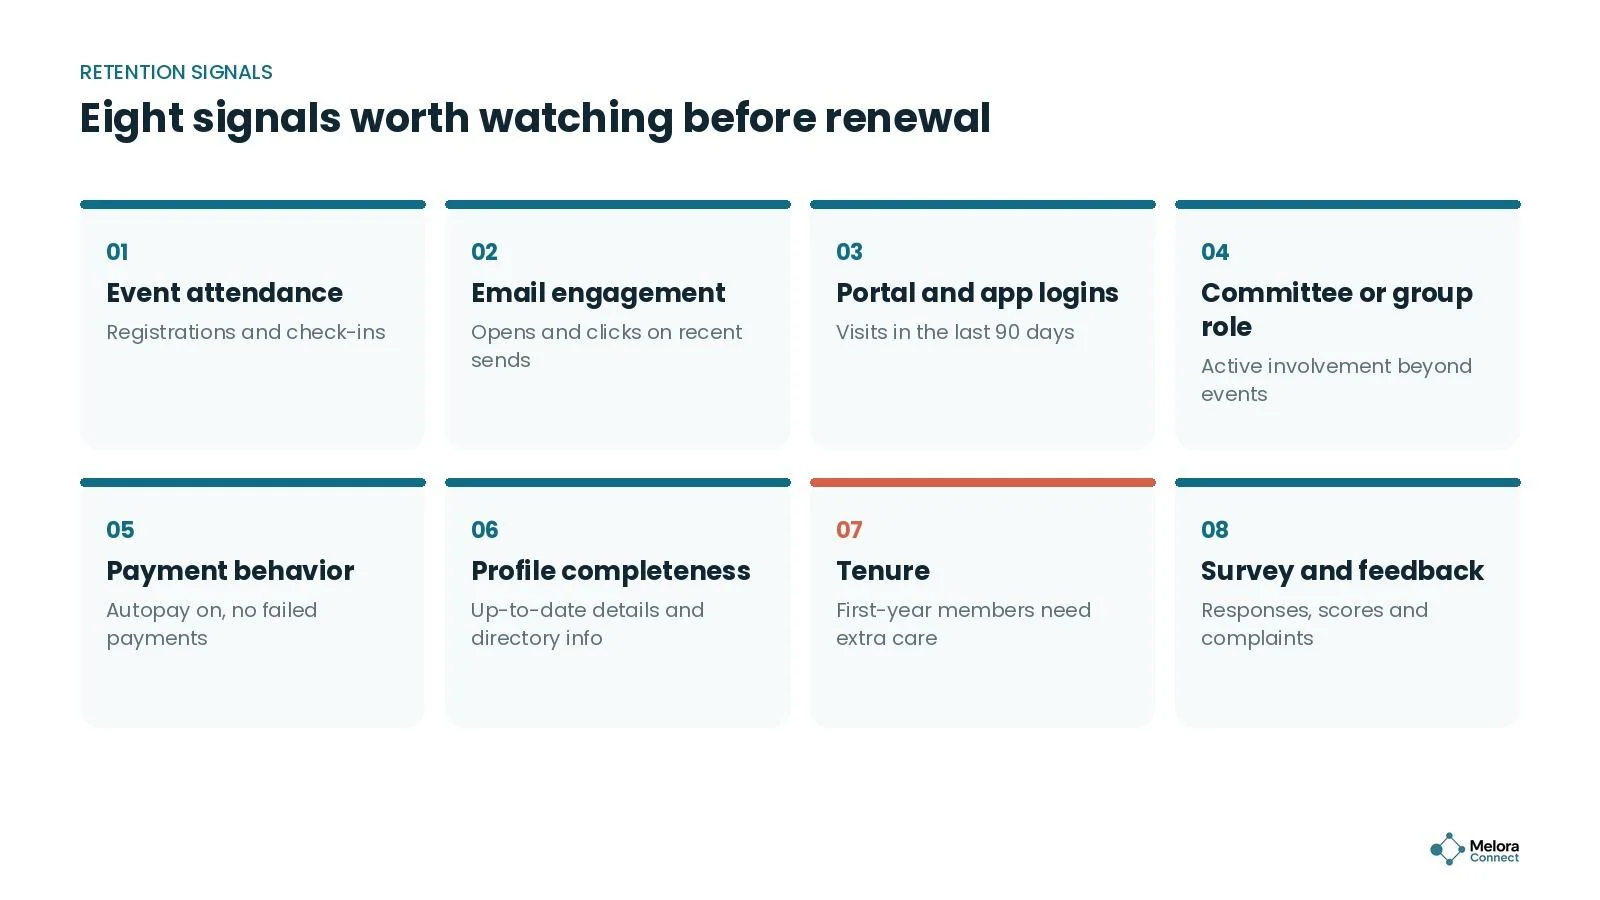
Every model starts from the same raw material: event attendance, email engagement, portal logins, committee roles, payment behavior, profile completeness, tenure, and feedback. Most of it is probably already in your systems. Our guide on how to identify at-risk members explains each warning sign and how to spot it by hand. This guide is about turning those signs into a score.
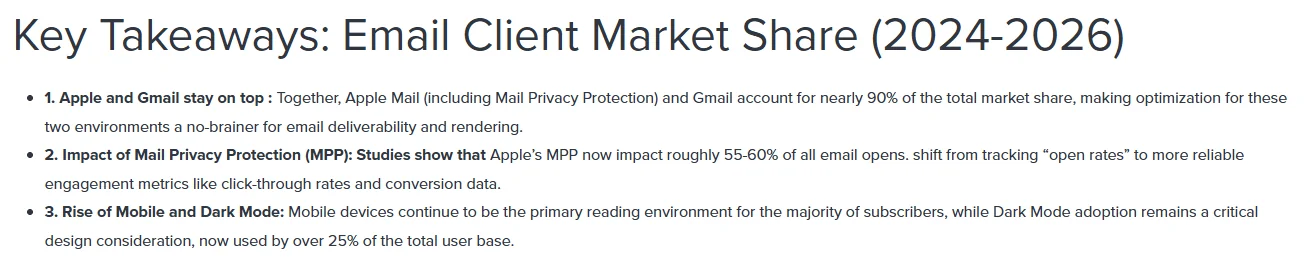
One caution on email. In Litmus’s email client market share data, Apple Mail Privacy Protection affects roughly 55% to 60% of all email opens, and it registers many messages as opened whether or not a person read them. Treat clicks, replies, and registrations as stronger signals than opens.
How to use predictive analytics for member retention in 6 steps
1. Bring your member data into one place
Predictions are only as good as the data behind them. If attendance lives in one tool, email activity in another, and renewal dates in a spreadsheet, nobody can see the full pattern. Start by connecting member records, payments, events, and email into one profile per member. An association management system is built for exactly this.
2. Look back at who renewed and who did not
Pull your last one or two renewal cycles and split members into two groups: renewed and lapsed. Then compare them on each of the eight signals. You are looking for the differences that stand out, such as lapsed members who attended no events in their final six months or stopped clicking emails three months out. Those differences become your predictors.
3. Choose a risk scoring model
Decide how you will turn signals into a number. Most associations start with one of two simple models: risk tiers based on an engagement score, or a risk score that adds points for each warning sign. Whichever you pick, set the points from what separated renewers from lapsers in step 2, and keep it simple enough that anyone on staff can explain why a member is flagged. The three models are compared below.
4. Set risk tiers and a time window
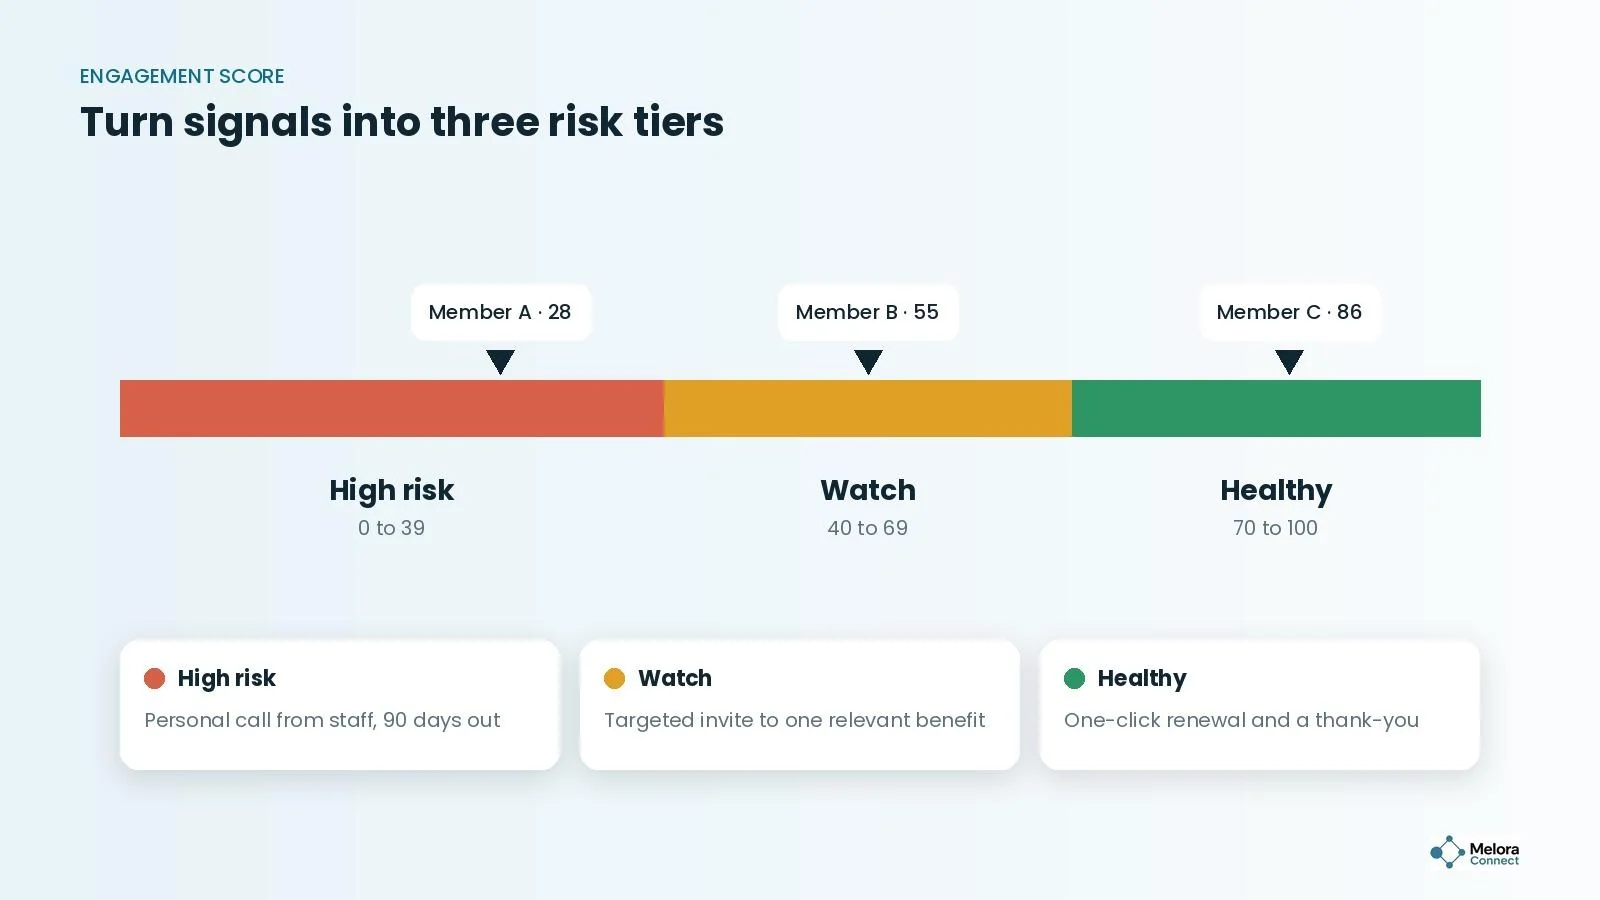
Split scores into three tiers, such as high risk, watch, and healthy, and decide when you will check them. A 90-day window before renewal gives you time for personal outreach without feeling rushed. For first-year members, check earlier as well, at around 60 days after joining.
5. Match every tier to an action
A score is useless without a response. Every tier needs a specific action, an owner, and a deadline, so a flagged member gets a phone call this week rather than a note in a report. The playbook below shows one way to set it up.
6. Measure, learn, and adjust
After each renewal cycle, compare predictions with what actually happened. Which high-risk members renewed after outreach? Which healthy members lapsed anyway, and what did you miss? Adjust the point values and thresholds, and your predictions will get sharper every year.
Three risk scoring models
There is no single right model. These three cover what most associations need, from a spreadsheet you can build this week to machine learning once your history supports it.
1. Engagement-based risk tiers
If you already score engagement, you already have a risk model. Members with a low engagement score are your high-risk group. Our guide to the member engagement score sets out which actions to count and how much each one weighs. To use it for retention, map the score to tiers: 0 to 39 is high risk, 40 to 69 is watch, and 70 to 100 is healthy.
This model is good at spotting members who are fading from your programs. It is weaker on members who stay active but run into friction, such as a failed card or an outdated contact.
2. A warning signal risk score
This model works the other way around. Every warning sign adds points, so a higher score means more risk. It catches the payment and contact problems an engagement score can miss, and you can build it from a simple export of your membership system. These weights are reasonable starting points, not a validated model:
| Signal | Points | Add the points when |
|---|---|---|
| Event attendance | +25 or +12 | No event in 12 months or more (+25), or last event 6 to 12 months ago (+12) |
| Email engagement | +20 or +10 | Open rate under 10% over 90 days (+20), or 10% to 25% (+10). Check clicks too, since privacy features inflate opens. |
| Portal logins | +15 | No login in 180 days or more |
| First-year engagement | +15 | First-year member who has not attended an event |
| Autopay | +10 | Not on autopay |
| Payment history | +10 | A failed payment in the last 12 months |
| Committee or volunteer role | −10 | Holds an active committee or volunteer role |
| Risk tiers | Score | High risk: 50 or more · Watch: 25 to 49 · Healthy: under 25 |
Tenure is not scored. Instead, track first-year members as their own group and check them earlier. Before you rely on the score, run it on last year’s members and check that the ones who lapsed scored high. Adjust the points until they do. The free Member Risk Scoring Sheet below does all of this in Excel.
Free download: Member Risk Scoring Sheet. Paste an export of your members into Excel and get a risk score, a tier and a suggested action for each one, with weights you can adjust. Download the Member Risk Scoring Sheet
3. AI-assisted scoring
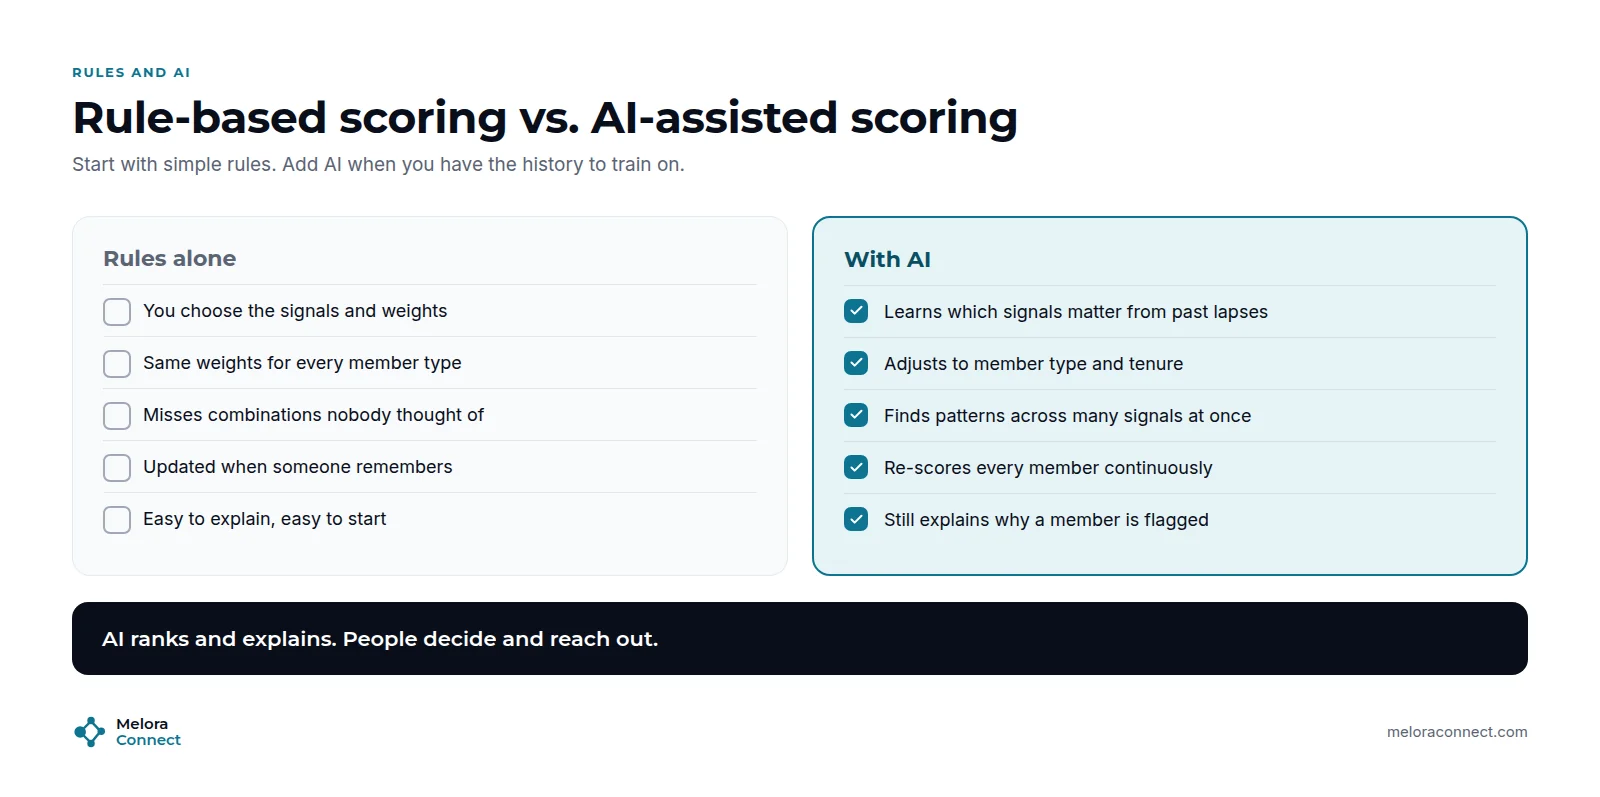
AI-assisted scoring learns from your own history. It looks at members who lapsed in past years, finds which combinations of signals came before, and weights them for each member type and tenure. It then scores every member again as new activity comes in, and explains why someone is flagged: “no events in 7 months, email clicks down 60%, renewal in 60 days.”
What AI does not do is decide. It ranks and explains, and your team decides who to call and what to say. The next section covers when it is worth the effort.
Retention playbook by risk tier
Whichever model you use, the tiers lead to the same actions. Use the engagement score bands for model 1 and the risk point bands for model 2.
| Risk tier | Score | Action | Owner | Timing |
|---|---|---|---|---|
| High risk | 0 to 39 engagement, or 50+ risk points | Personal call or email from staff, plus an invitation to one benefit that fits their interests | Membership director | 90 days before renewal |
| Watch | 40 to 69 engagement, or 25 to 49 risk points | Targeted message about benefits they have not used yet, such as an upcoming event or committee | Membership team | 60 to 90 days before renewal |
| Healthy | 70 to 100 engagement, or under 25 risk points | One-click renewal, autopay reminder, and a thank-you | Automated | 30 to 60 days before renewal |
| First-year (any score) | All | Welcome sequence, one recommended event, and an introduction to another member | Membership team | Days 1 to 90 after joining |
Example: the member firm that almost lapsed
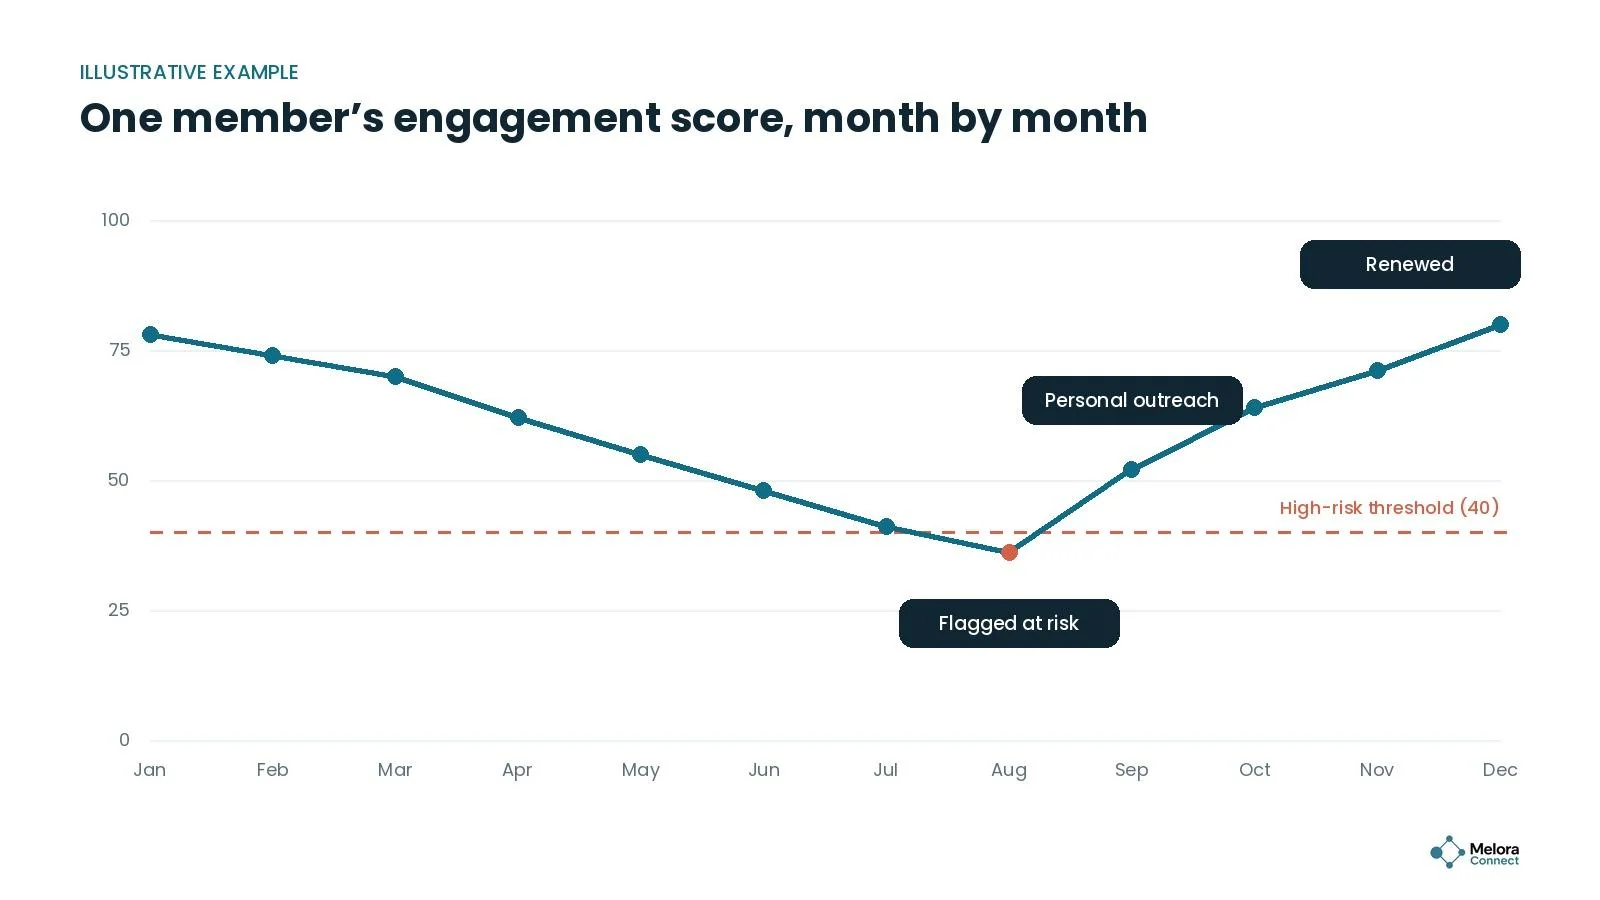
Illustrative example. Picture a regional trade association with 600 member companies. One of them, a mid-sized engineering firm, has been a member for four years. In spring, its two regular event attendees change jobs. Event registrations stop, email clicks fall off, and nobody from the firm logs in for three months.
Without predictive analytics, nobody notices. The renewal invoice reaches a finance manager who has never attended an event and cannot say why the firm joined. It goes unpaid, and the firm drops off the member list in January.
With an engagement score, the firm is flagged in August, when its score falls below the high-risk threshold, four months before renewal. The membership director calls, learns about the staffing change, and asks who the new contacts should be. She updates the record, invites the new project lead to a technical roundtable, and introduces him to two peer firms. By December, the score is back above 70, and the firm renews.
The data did not save the membership. The phone call did. The data just made sure the call happened in time.
Do you need AI for predictive analytics?
Not to get started. A rule-based model like the first two above captures most of what a small or mid-sized association needs, and it has one big advantage: everyone can see why a member is flagged.
Machine-learning models can find patterns a simple score misses, but they need a lot of clean historical data, often several years of renewals across thousands of members, and someone who can check whether the results make sense. The NIST Generative AI Profile (NIST AI 600-1, July 2024), a voluntary framework from the US National Institute of Standards and Technology, lists risks such as confabulation and data privacy that apply here too. Whatever approach you use, keep these guardrails in place:
-
Explainability: staff should be able to say why a member was flagged, in plain language.
-
Human judgment: a score is a prompt to look closer, not a verdict on a member.
-
Privacy: only use data members would reasonably expect you to use, and be open about how you use it.
-
Help, never penalize: no price changes or reduced benefits based on a score.
-
Blind spots: check that the model does not keep flagging one group because of how its data was collected.
What you need before AI can help
-
One record per member. Attendance, email, payments and logins in one place, not five tools.
-
At least two renewal cycles of history, so there are real lapses to learn from.
-
Known outcomes. Who renewed and who did not, recorded the same way every year.
-
Enough members. With a few hundred members or more, patterns become reliable. Below that, rules usually work as well.
If you are not there yet, start with a rule-based score and fix the data gaps it exposes. That work is what makes AI useful later. AI is already useful for the outreach itself: our free AI Prompt Library for Associations has prompts for drafting personal check-in messages to at-risk members. For other ways associations are putting AI to work, see AI for associations, and for what to ask vendors, see our guide to AI association management software.
5 common mistakes with predictive analytics
Scoring without acting. A dashboard full of at-risk members that nobody calls changes nothing. Assign every tier an owner.
Waiting until the renewal month. By then the decision is made. Start at 90 days, and earlier for first-year members.
Copying someone else’s model. The signals that predict renewal for a chamber may not match a professional society. Test against your own history.
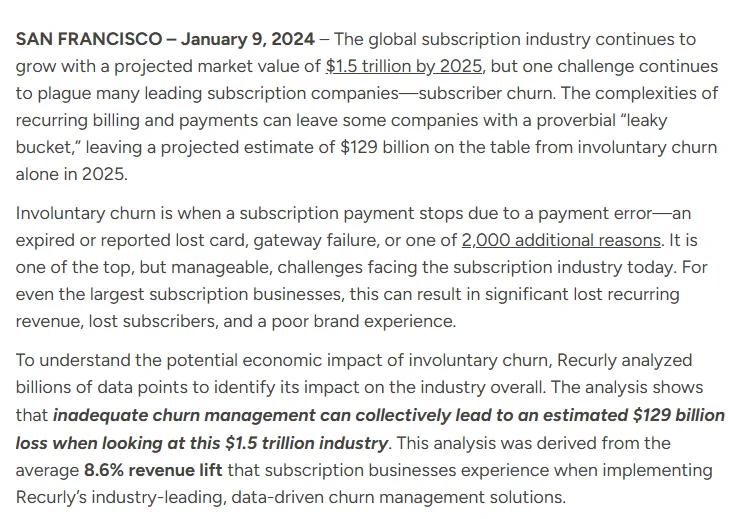
Ignoring payment friction. Some members who look at risk simply have an expired card or an old email address on file. Failed payments are a large, fixable leak across all subscription businesses: Recurly projected they could cost subscription companies more than $129 billion in 2025. Fix the easy problems first.
Never checking the predictions. If you do not compare predicted and actual results each cycle, the score will drift away from reality.
Which risk scoring model should you start with?
Pick the model that matches your data today. You can move up later.
-
A few hundred members or fewer, or one renewal cycle of data: start with the warning signal risk score and the scoring sheet. It works from a simple export.
-
Engagement already tracked on one record per member: use engagement-based tiers, and add payment and contact checks so friction does not slip through.
-
Several years of renewal history and consistent tracking: test an AI-assisted model against your rule-based score before you switch.
Not sure which model fits your data? Book a demo and see how your member data could come together in Melora Connect. Book a Melora Connect demo
How do you know your risk model works?
The number that matters most is your prediction hit rate: lapsed members who were flagged in advance, divided by all lapsed members, times 100. If many lapsed members were never flagged, your model is missing a signal. For at-risk save rate, first-year renewal rate and the other formulas, see our guide to member engagement metrics. To report the hit rate and save rate to your board, use our free Board Report Template.
How Melora Connect approaches member retention
Prediction starts with seeing the whole member, and that is hard when the data lives in five tools. Melora Connect keeps one record per member, and everything else pulls from it: payments, event registrations and check-ins, email campaigns, committees, chapters, CE credits, surveys, and directory profiles. For online events, Melora creates the Zoom meeting and checks in the people who joined, so virtual attendance counts as a signal too.
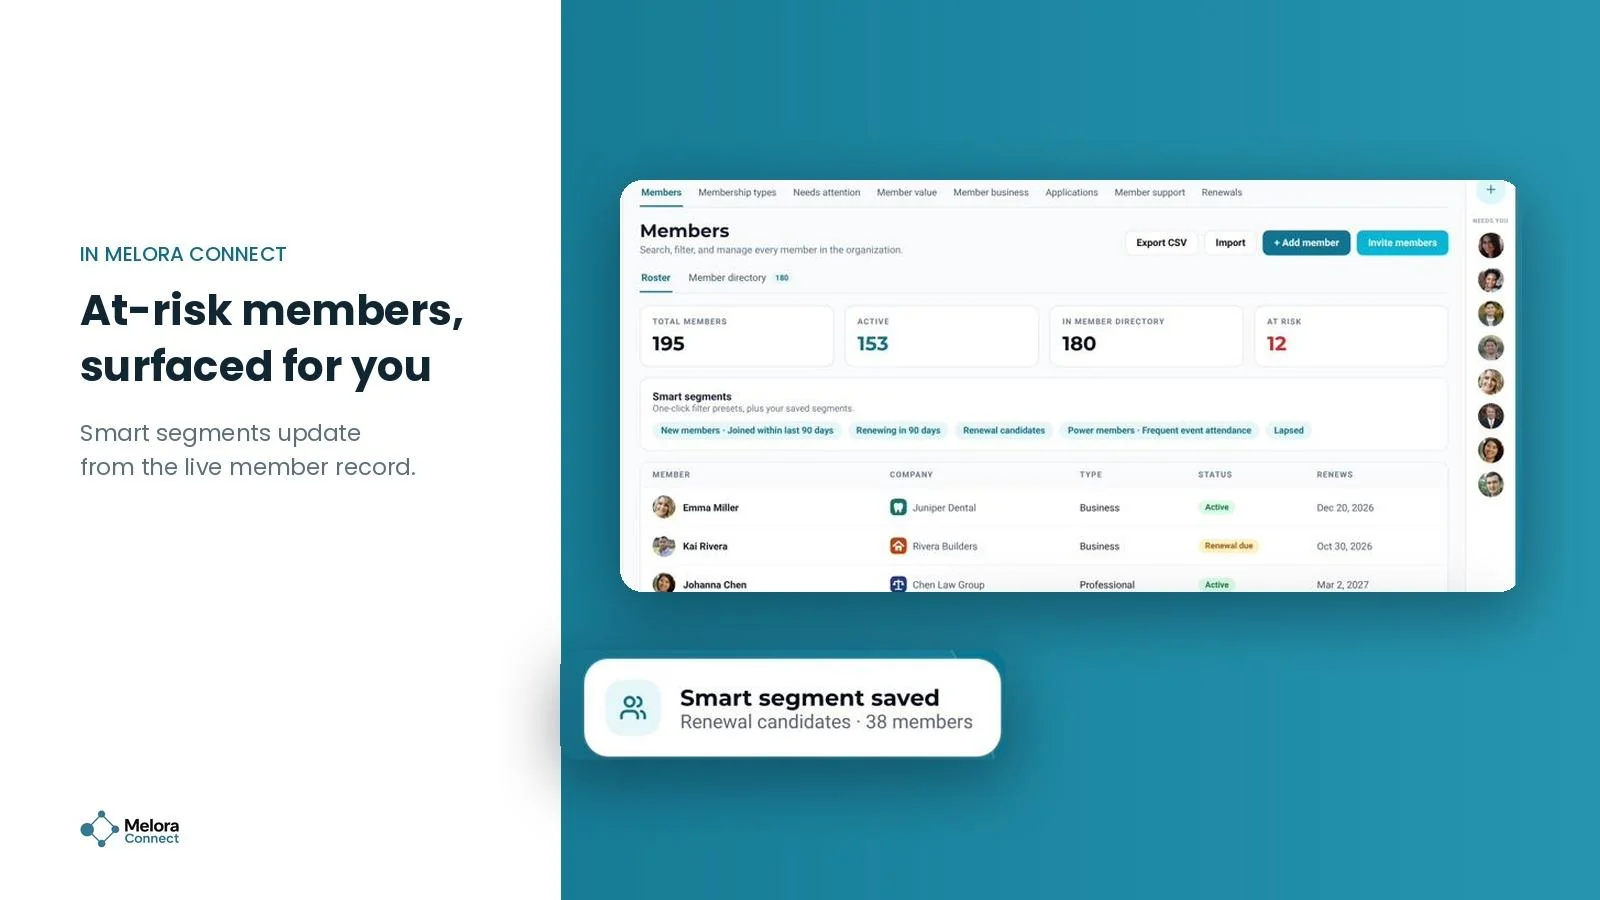
Smart segments surface new, at-risk, and lapsed members, engagement scoring runs on the same record, and the Monday morning briefing flags at-risk members with renewals due in the next 90 days. From there, staff can send a targeted campaign with merge fields from the live record, invite members to the right event, or pick up the phone. Saved-card autopay and automatic reminders handle the friction-based lapses, so your team can focus on the ones that need a personal touch.
Want AI help with the analysis or the outreach? Teams can already connect their own AI assistant, such as Claude or ChatGPT, to Melora Connect with an API key. A built-in staff AI assistant is coming soon. Either way, the rules your team can see stay in charge of who gets flagged.
And because you get a team, not a login, we help you set up the segments and signals that fit your members, then leave the conversations to the people your members know.
Put your risk tiers to work in Melora Connect. Book a demo and we will walk through at-risk segments and the Monday briefing using member types like yours. Book a Melora Connect demo
Frequently asked questions about predictive analytics for member retention
What is predictive analytics for member retention?
It is the use of member data, such as attendance, email activity, logins, and payment history, to estimate which members are likely to lapse, so you can reach out before their renewal date.
What data do you need to predict member churn?
At minimum: renewal history, event attendance, and email engagement for each member, all linked to one record. Portal logins, committee roles, payment behavior, and survey responses make predictions sharper.
How far ahead can you predict that a member will lapse?
Warning signs often appear months before renewal. A 90-day window is a practical place to start, with an earlier check for first-year members at around 60 days after joining.
Do small associations need predictive analytics?
Small associations often benefit the most, because every lapsed member is a bigger share of revenue. A simple risk score and a clear outreach plan are enough to start. AI adds value later, once you have consistent data and a few renewal cycles of history.
Is a member engagement score the same as predictive analytics?
An engagement score is the simplest input to it. Mapped to risk tiers, it flags members likely to lapse. A warning signal risk score or a machine learning model adds other angles, but the goal is the same.
Are email open rates reliable for predicting churn?
Not on their own. Apple Mail Privacy Protection affects roughly 55% to 60% of opens and can mark emails as opened that nobody read. Use clicks, replies, registrations and logins alongside opens.
Is it ethical to score members?
Yes, if you use scores to help rather than penalize, explain why members are flagged, keep a person in the loop, and follow your privacy policy.
The bottom line
Predictive analytics for member retention is not about algorithms. It is about noticing, early enough to matter, when a member starts drifting away.
Bring your data into one place, look at what your lapsed members had in common, build a simple risk score, and give every risk tier an owner and an action. Then check your predictions each year. The associations that keep members best are not the ones with the most data. They are the ones that act on it in time.
Sources
-
Marketing General Incorporated blog, The First 30 Days: Turning New Members into Engaged Members, October 22, 2026 (citing the 2026 Membership Marketing Benchmarking Report).
-
iMIS (ASI), Sneak Peek: 2026 Membership Performance Benchmark Report, January 2, 2026.
-
Litmus, Email Client Market Share, 2026.
-
Recurly, Failed payments could cost subscription companies more than $129 billion in 2025, October 1, 2024.
-
National Institute of Standards and Technology, Artificial Intelligence Risk Management Framework: Generative Artificial Intelligence Profile (NIST AI 600-1), July 2024.